HOW TO MAP LANDING STRIPS
Potential landing strips had to be assessed by the RAF. Maps (1:25000) and aerial photographs provided an overview, but more detailed data of the terrain surrounding the landing strip was needed. It should be remembered that agents in the field communicated with the UK using W/T (wireless telegraphy), so a formal method was needed to transmit this information.
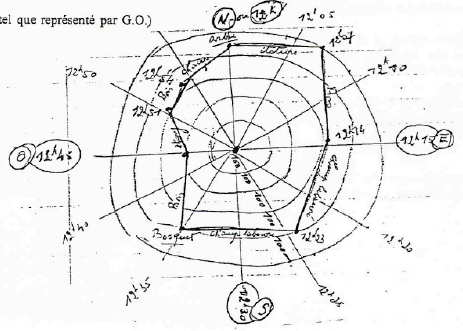
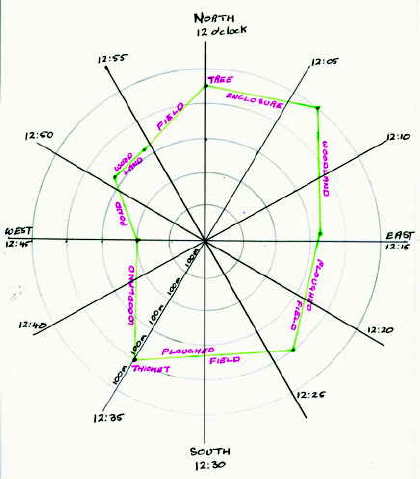
The sender and the receiver of the message had to work from the same map. The landing strip was given as a pinpoint (eg 49° 21' 40'' N x 03° 37' 45'' E). The map was viewed as the face of a clock; so 12 o'clock pointed north, 12:15 - east, 12:30 - south, etc. With the landing strip as the focal point, circles radiated out, on the map, representing intervals of 100 metres on the ground. Thus a map could look as the diagram on the left. This graphical representation was then transcribed, as in the table on the right, for transmission:
 |
|
Note: these diagrams were taken (and adapted) from Georges d'Oultremont's original drawings: